Dartmouth Investment Manager Diversity
Manager Diversity Report
The Dartmouth College Investment Office continues to commit to playing a role in improving the diversity of the investment management industry. To do so, our office seeks to engage with the endowment’s external investment managers on topics related to Diversity, Equity, and Inclusion (DEI). This engagement includes active monitoring, discussion, and collaboration with our investment managers on their DEI efforts.
As part of this effort, our office surveyed the endowment’s investment managers on the diversity characteristics of their organizations; a summary of the ensuing analysis is presented below. This data serves as a basis to evaluate our investment managers’ progress over time against DEI goals. Our survey indicates 24% of Dartmouth’s U.S.-based assets are diverse-owned based on the methodology used by Preqin and in the study conducted by the Knight Foundation. We also measure diversity in our global managers and our U.S. managers at various higher ownership thresholds.
Additionally, we highlight diversity by seniority within our managers’ investment teams as we view our managers’ analyst- and associate-level roles as areas where firms can broaden diversity more rapidly. We plan to re-survey portfolio managers periodically to monitor the evolution of team diversity over time.
Diversity by Ethnicity Across all Employees of Our U.S. Managers
Bar chart below: Grouped by Total Staff, Investment Staff, and Other Staff, the percentage of employees
by ethnicity across all groupings are 66% White, 21-23% Asian, 2-3% Black, 4% Hispanic/Latino,
and 4-6% Other.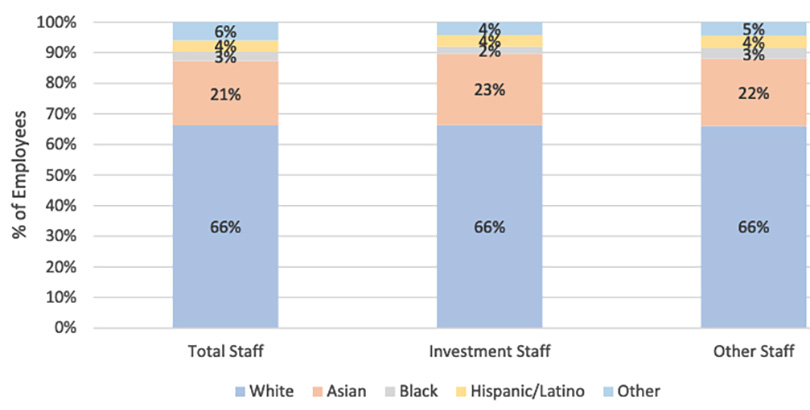
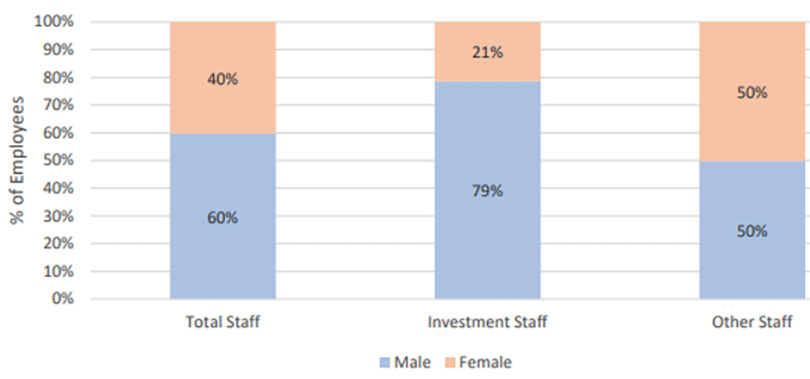
Diversity by Gender Across all Employees of Our U.S. and Global Managers
Bar chart below: The percentage of employees by gender, grouped by category. Total Staff: 60% male, 40% female; Investment Staff: 79% male, 21% female; Other Staff: 50% male, 50% female.
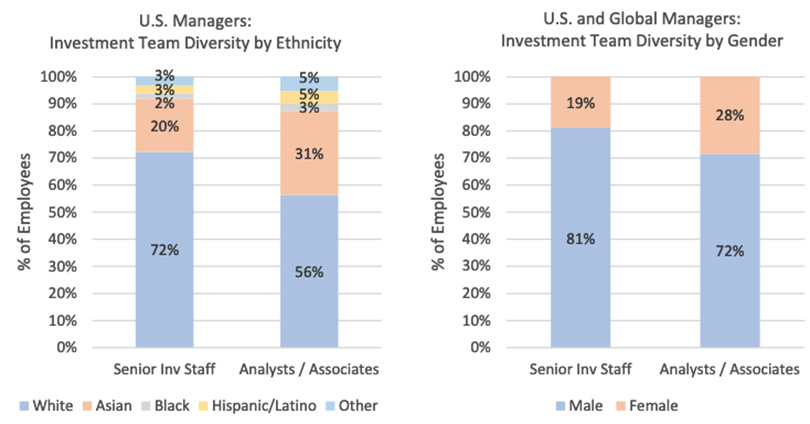
Diversity by Seniority Across Investment Teams of Our Managers
Bar chart on left below: U.S. Managers: The percentage of senior investment staff by ethnicity: 72% White, 20% Asian, 2% Black, 3% Hispanic/Latino, and 3% Other. The percentage of analysts/associates by ethnicity: 56% White, 31% Asian, 3% Black, 5% Hispanic/Latino, and 5% Other.
Bar chart on right below: U.S. and Global Managers: The percentage of senior investment staff by gender: 81% male and 19% female. The percentage of analysts/associates by gender: 72% male and 28% female.
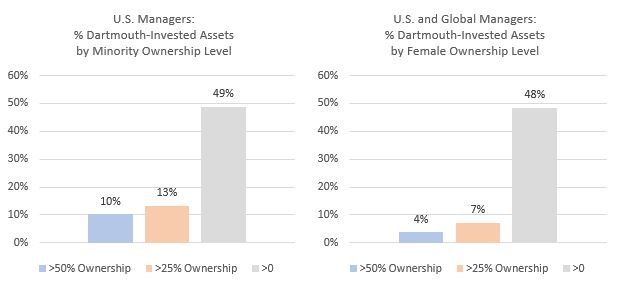
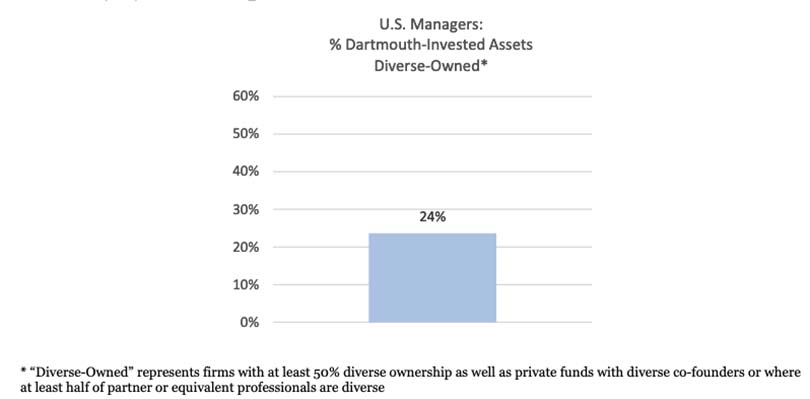
Diversity by Ownership
Bar chart below: For U.S. managers, 24% of Dartmouth-invested assets are invested with diverse-owned firms. “Diverse-owned” represents firms with at least 50% diverse ownership as well as private funds with diverse co-founders or where at least half of partner or equivalent professionals are diverse.
Bar chart on left below: Minority Ownership – U.S. Managers: 10% of Dartmouth’s investment assets are managed by firms with > 50% minority ownership, 13% of assets are invested with firms with > 25% minority ownership, and 49% of assets are invested with firms with > 0% minority ownership.
Bar chart on right below: Female Ownership – U.S. and global managers: 4% of Dartmouth investment assets are invested with firms with > 50% female ownership, 7% of assets are invested with firms with > 25% female ownership, and 48% of assets are invested with firms with > 0% female ownership.