Office of the Registrar
Dartmouth College
Office of the Registrar
6014 McNutt Hall
Hanover, NH 03755-3541
Phone: (603) 646-2246
Fax: (603) 646-2247
Email: registrar@Dartmouth.EDU
Course Assessment Student View: Intersection Report
The intersection report displays data on a course taught by a specific faculty member.
Sample Faculty/Course Report

A. Select a Question – Using the drop down box, choose the question for which you want to see data here. The questions are:
- I think the overall quality of the course was
- I put a great deal of effort into the course
- I was intellectually engaged in the course
- The objectives of the course were clear to me
- I found the course to be well organized
- The assignments reinforced my understanding of the course material
- I think the overall effectiveness of the teaching was
- The professor challenged me to think critically about the course material
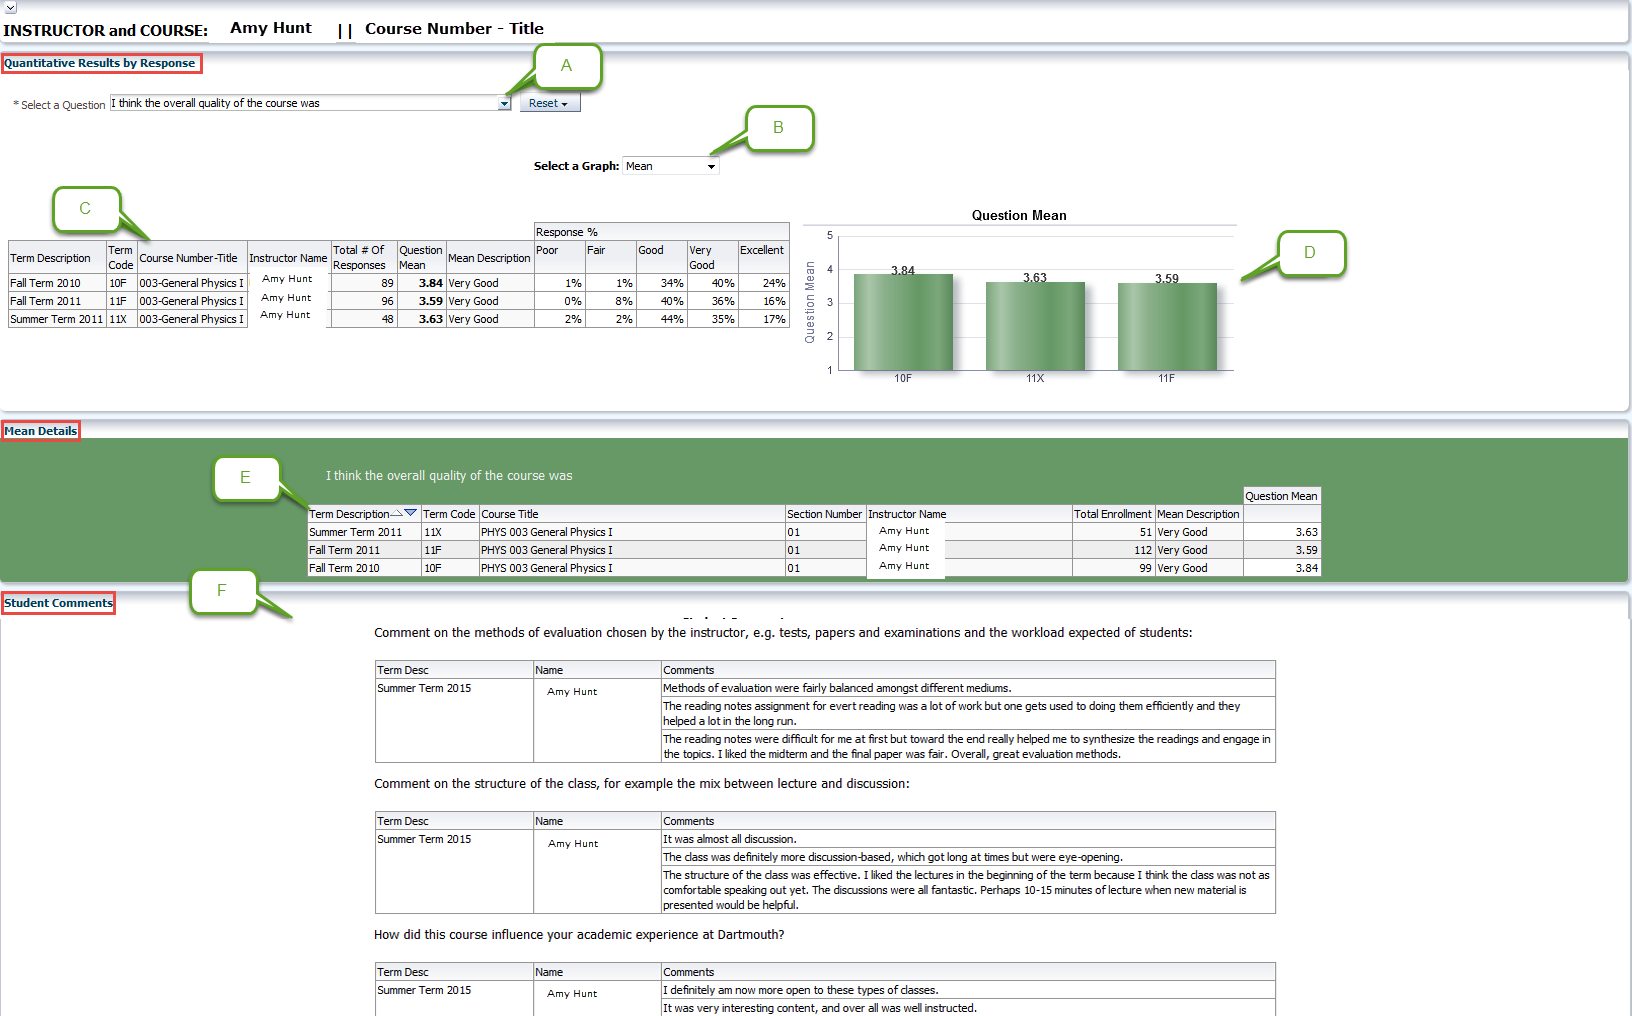
B. “Select a Graph” - This option allows you to view the graphical data. There are three types of graphs: a mean graph, a response distribution graph by %, and a pie graph.
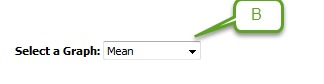
C. Data tables - Here is where you view the question response mean (average) and response distribution across categories data as percentages.
- "Total Responses" indicates the total number of students who answered the selected question. This number is total number of responses per term.
- "Question Mean" indicates the mean (average) value of the responses. This number is on a scale of 1-5 with 5 as the best possible score.
- "Mean Description" provides the translation of the numeric score to English descriptions (which correlate to the categories you saw while completing assessments) – "good," very good," etc.
- "Response %" - this set of data displays the response distribution across categories.This allows you to see, for example, 003-General Physics I taught in the fall of 2010 had 89 students completed assessments, and 40% of them responded with "very good."
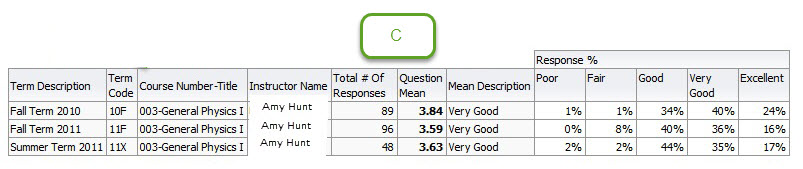
D. Question Mean Graph - This graph displays the mean/average response over time.
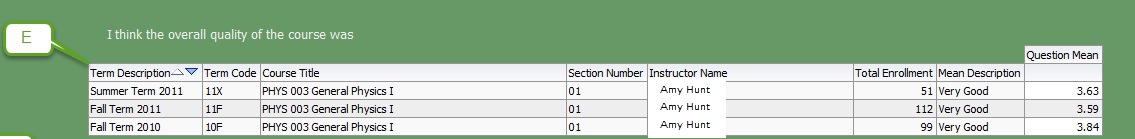
E. The Mean Details section of the report provides more detailed data in a table format. Data is broken out by term providing both a historical view of the course and the opportunity to view trends in the data.
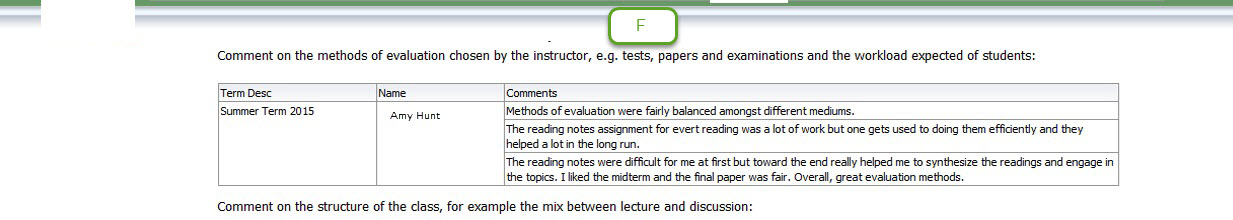
F. Student Comments – This section displays all the responses to the student-initiated questions in the assessments. These are the reactions and views of your peers.
- Comment on the methods of evaluation chosen by the instructor, e.g. tests, papers, and examinations and the workload expected of students
- Comment on the structure of the class, for example the mix between lecture and discussion
- How did this course influence your academic experience at Dartmouth?
