
MIT Sloan Sports Analytics Conference
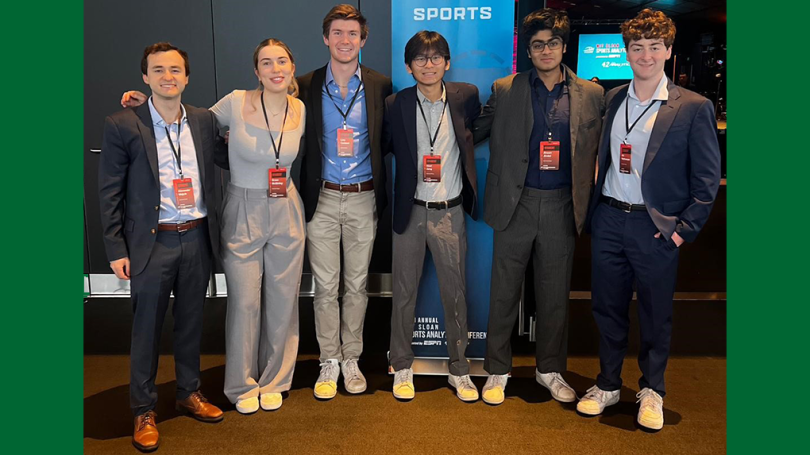
Six students attended the 2024 MIT Sloan Sports Analytics Conference in Boston.
Click here for additional details.
QSS 82 one quarter research projects, Winter 2024
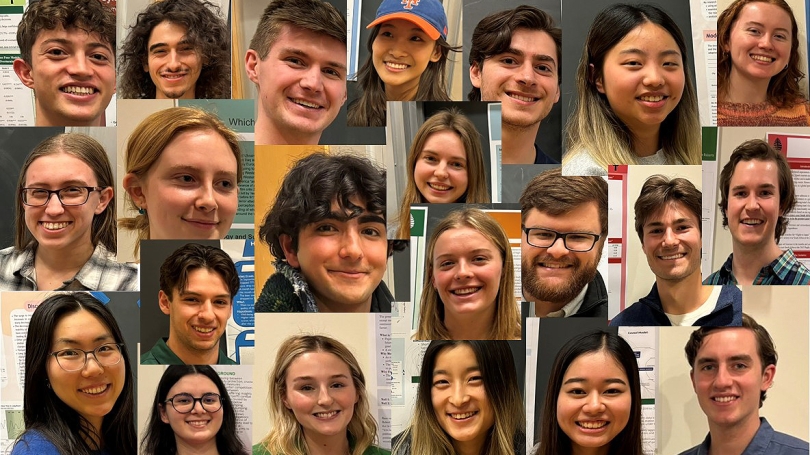
On Monday, March 6, students majoring and minoring in Quantitative Social Science (QSS) presented posters from research projects carried out in QSS 82. In Winter 2024, this project course was taught by Assistant Professor Elsa Voytas and Senior Lecturer Robert Cooper. There were 22 posters across the two sections of QSS 82.
Click here for additional details.
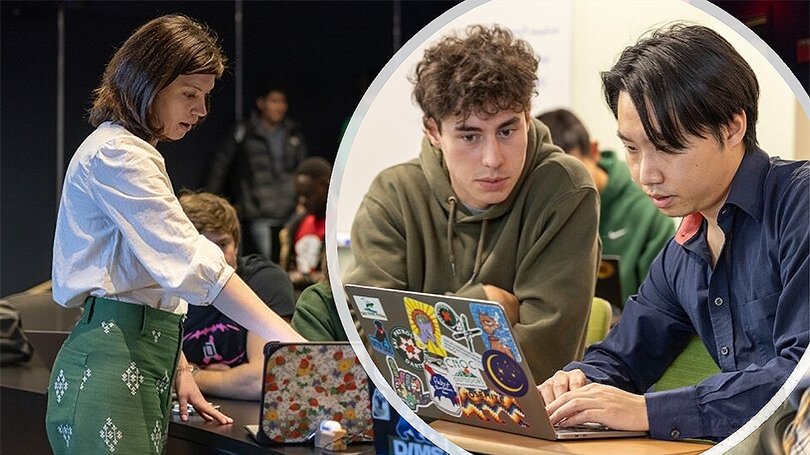
Inside Arts and Sciences features new QSS faculty
Professors Chang and Voytas are featured in an article on the growth and continued development of quantitative social science at Dartmouth.
Click here for additional details.
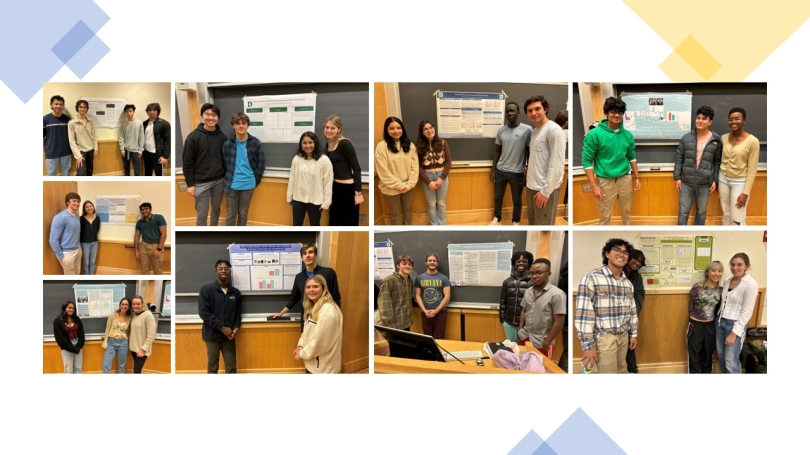
QSS 15 poster session, Fall 2023
On Friday, November 10, students in QSS 15: Introduction to Data Analysis presented posters that represented the culmination of their group research projects.
Click here for additional details.
QSS Open House
QSS welcomes the Dartmouth Class of 2027!

Andrew A. Samwick
- Sandra L. and Arthur L. Irving '72a P'10 Professor of Economics