Wow, I can't believe that it's been over 30 months since I was writing my application to Dartmouth as a high school senior. Today, I'll go line by line to see how my "Why Dartmouth?" essay has evolved over these past two years.
Dartmouth Admissions
Dartmouth College Admissions
Dartmouth in a Word?


People Places Pines

Dartmouth's liberal arts curriculum pushes students to explore new departments and draw connections between seemingly disparate disciplines. Come explore my Economics, Physics, and Asian, Societies, Cultures, and Languages classes!

Sydney Wuu
2024

Aside from taking classes this term, I will also be completing my second term of the Presidential Scholars Program.

Chidera Duru
2025

Explaining everything that goes into becoming a Dartmouth tour guide.

Julia Cappio
2027

Over half of Dartmouth students study abroad at least once during their undergraduate journeys—quite a high percentage, right? Do you want to know how to best prepare for your own abroad experience? Come check what it was like for me.

Antônio Jorge Medeiros Batista Silva
2025

What it's like to shadow a medical professional?

Caroline York
2025

The English minor at Dartmouth consists of any six classes in the department that you want to take. Here's what I took!

Simon Lamontagne
2024

Here is a little peek into how I made my spring break after studying abroad and before Spring term; a relaxing, rejuvenating & explorative experience!

Andrea Agola
2026


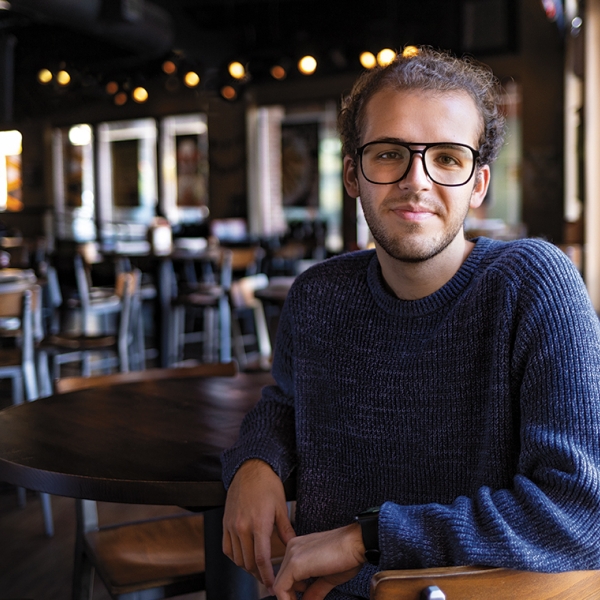
The "Why Dartmouth" supplement was the hardest for me to write. How would I explain all the reasons I loved Dartmouth in 100 words? I chose Dartmouth because of how the people and campus made me feel. Dartmouth radiates excitement.

Gabriela Jimenez
2027

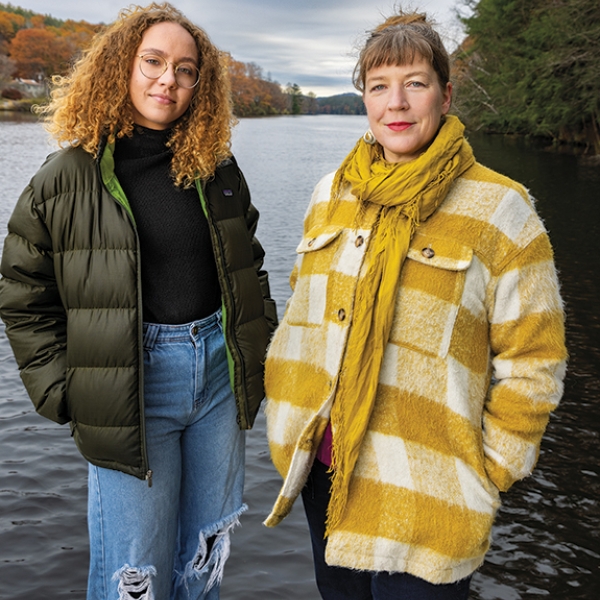
The Upper Valley is full of great places to visit and things to do beyond the Dartmouth campus. Here's one of my favorites!
Simon Lamontagne
2024

Yes. You can afford Dartmouth.
100
Percent of demonstrated financial need met, no matter who you are or where you're from.
How Financial Aid WorksRead 3D Magazine
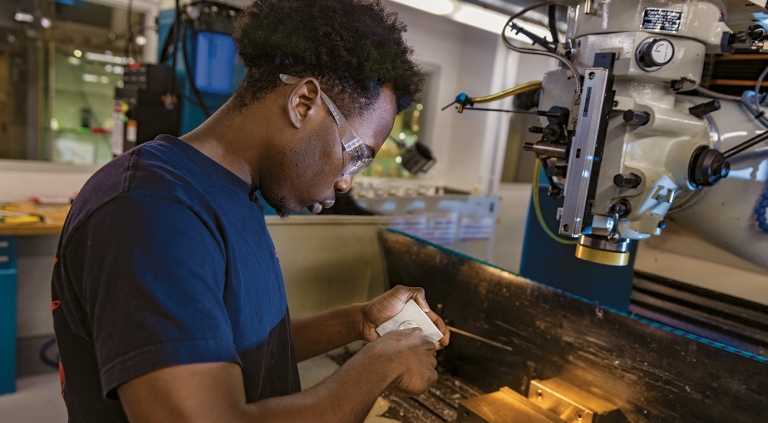
Innovating For Impact
Innovative ideas come to life at Dartmouth, where bold solutions to the world's most pressing challenges spark collaboration across disciplines—and undergraduates play key roles in making that happen
Innovating For Impact
Innovative ideas come to life at Dartmouth, where bold solutions to the world's most pressing challenges spark collaboration across disciplines—and undergraduates play key roles in making that happen
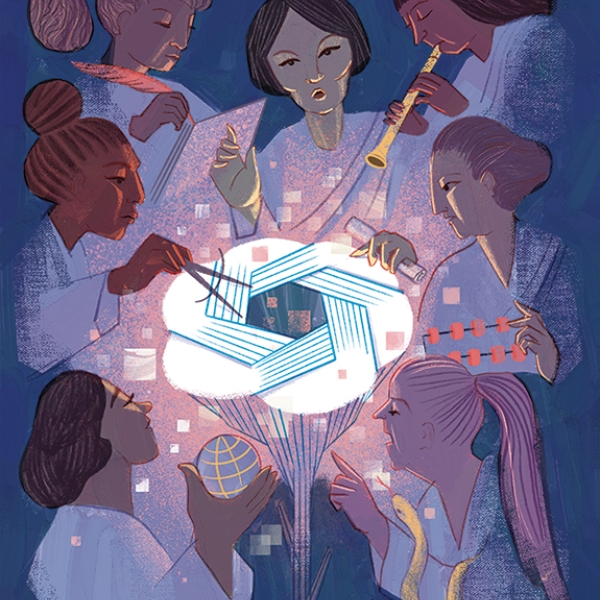
A 360-Degree Education
For Dartmouth professors, teaching is a passion, a calling, a way of life. Mentorship is instinctive, one of the most rewarding aspects of their scholarship. Dartmouth faculty members are also pioneering researchers and influential thought-leaders. Their work with students helps them advance the frontier of knowledge and helps students advance their careers. Dartmouth classrooms are interactive, collaborative, discussion-based environments.
Areas of StudyScholars Who Teach
William Cheng
Associate Professor of Music
"I work at the intersection of sound and justice. By lending an ear to imperatives of care and accessibility, I engage questions about vulnerability, solidarity, and survivability of humans and humanity in late-capitalist environments. My research asks how music and musicians can help us answer these questions."
Learn More About Arts and Performing Arts Programs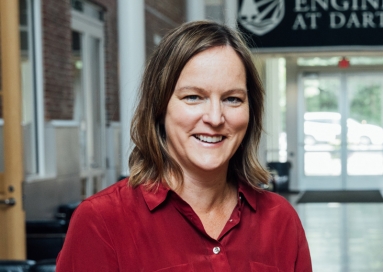
Vicki May
Associate Professor of Engineering
"Many years ago, architects and engineers were the same thing—master builders. The field of engineering has become increasingly specialized, especially at schools and in some companies. That has made the field more narrow and scientific. But I think science and engineering should be about discovery."
Learn More About Engineering Programs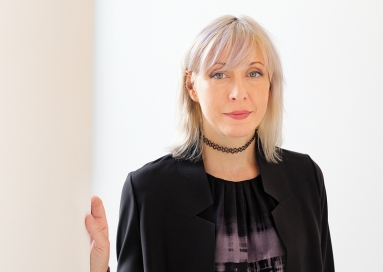
Mary Flanagan
Sherman Fairchild Distinguished Professor in Digital Humanities
"Games are broadly interdisciplinary. They encompass computer science, psychology, sociology, music, art, neuroscience, and more. They're what the liberal arts are all about. We teach our students to think across disciplines. They develop their ability to attack problems, ask productive questions, and invent fresh solutions."
Learn More About Humanities Programs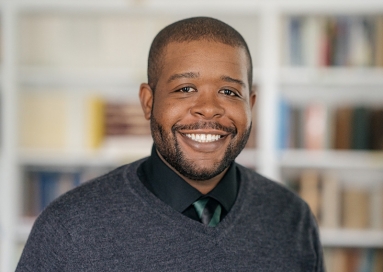
Vaughn Booker
Assistant Professor of Religion and African and African American Studies
"I help students understand that racial identity and religious belonging have never remained unchanging in American history. To comprehend religion and race, students must account for histories of nuance, according to region, age, class, gender, sexuality, ethnicity, and enslaved/free/citizenship status."
Learn More About Interdisciplinary Programs
Lisa Baldez
Professor of Government, and of Latin American, Latino and Caribbean Studies
"My research examines the extent to which formal institutional rules shape the possibilities for achieving gender inequality. I focus on human rights treaties, specifically the United Nations convention to Eliminate All Forms of Discrimination Against Women, gender quota laws, and the Equal Rights Amendment."
Learn More About Interdisciplinary Programs
Nicola Camerlenghi
Associate Professor of Art History
"Dialogue and conversation about the architecture brings it alive, both for me and the students. This stuff is more than just an image on a screen. Making it part of a bigger discussion about Rome, about what buildings do--that's been personally rewarding for me."
Learn More About Arts and Performing Arts Programs
Admissions Beat Podcast
Basecamp to the World
Measure glaciers in Antarctica with climate-change scientists. Perform with a renowned theater group at Kings College London. Study the Maori language in New Zealand. Arranged through Dartmouth's Frank J. Guarini Institute for International Education, these powerful learning experiences are enhanced through faculty mentorship.
Start Here View Locations List


