Home >
Evans Map Room >
Maps Created Using Geographic Information Systems
GIS Maps of the Month exhibits
To highlight the uses of Geographic Information Systems (GIS) software, staff in the Evans Map Room are creating a series of maps. The data could spotlight a current event, look at historical data or show a faculty member's current research. All of the maps for this year long exhibit come from the Evans Map Room. If you have questions, please let us know.
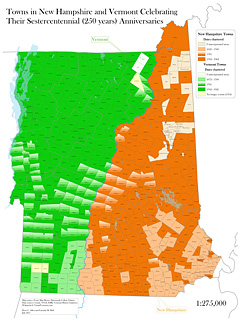 |
Various towns in New Hampshire and Vermont are celebrating their sestercentennial anniversaries. These towns have existed for 250 years. This map highlights those towns. |
 |
This is a simple map of New Hampshire and Vermont showing town and county boundaries. With GIS, you can style the map however you want. |
 |
This map illustrates a study area for Andrew Mellon Postdoctoral Fellow Benjamin Madley working in the Native American Studies Program and the Department of History. |
 |
This map is one of series showing the changes in population in Vermont towns through the 20th century. |
 |
New Hampshire's GRANIT site has all types of data available to map in GIS software. This layer is one example. |