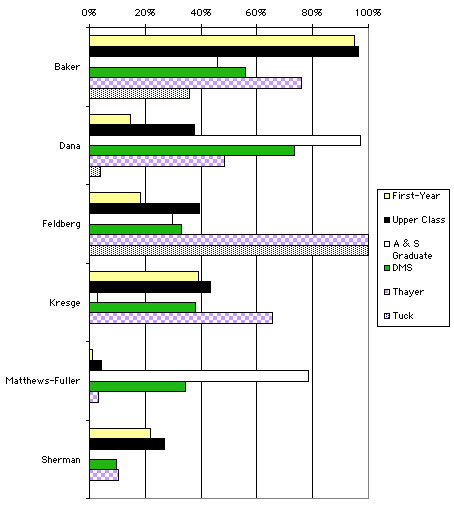
| 1. Which Libraries Are Used? |
| Eighty-six percent of the students reported using one or more of Dartmouth's libraries. Ninety-five percent of the first-year and 97% of the upper class students reported using Baker library. Ninety- seven percent of the Arts and Sciences graduate students and 73% of the DMS students used Dana. All the Thayer and Tuck students reported using the Feldberg library. |
|
|
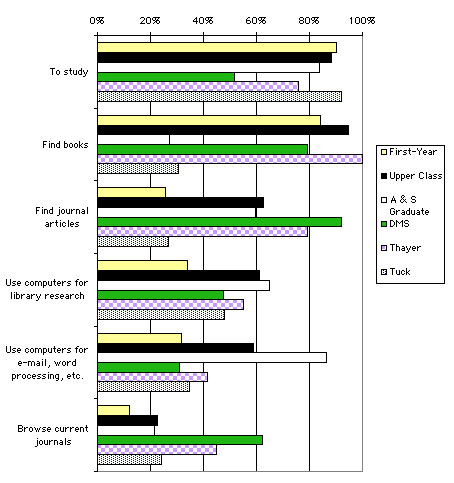
| 2. Why Students Use the Library |
| To study" and to "find books" were the principal uses of the library by the undergraduate students. Eighty-four percent of the Arts and Sciences graduate students and 92% of Tuck students reported using the library "to study," but neither group were very likely to use the library to "find books." Arts and Sciences graduate students were distinctively likely to "use computers for e-mail, word processing, etc." DMS students were distinctively likely to "find journal articles." All Thayer students reported using the library to "find books." |
|
Note: The library's items "to work on assignments," "to meet fellow students," and "for lectures, seminars, classes" were left off the questionnaire by the programmer.
Written Responses to "Other" uses
Reserve reading (12 entries)
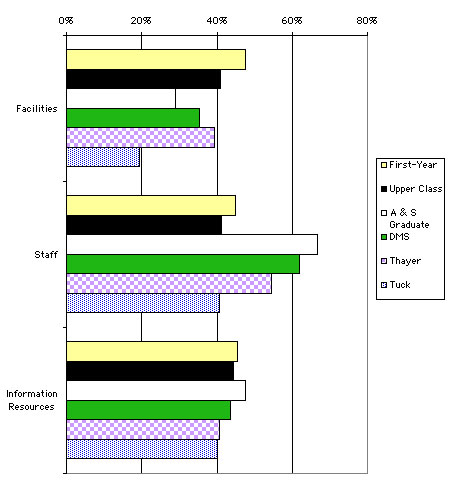
| 3. Overall Satisfaction with Library Facilities, Staff, and Information Resources |
| Over 90% of these students were at least satisfied with the library facilities, staff, and information resources. The graph shows the highest level of satisfaction - very satisfied. Less than half of these students were very satisfied with the library "facilities," with Tuck students reporting the lowest percentage at 20. Over half of the Arts and Sciences graduate, DMS, and Thayer students were very satisfied with the library "staff." Between 40 and 50% of all these students were very satisfied with the "information resources" of the library. |
|
| 4. Why Students Never or Rarely Visit the Library |
| Only 14% of all students (92 from 661) reported that they never or rarely visited the library, 59% of which being undergraduate students (57). The principal reason cited was "don't need to for my work," but only 29 students marked this reason. The second most frequent reason was "I use electronic resources principally," with only 19 students marking this reason. |
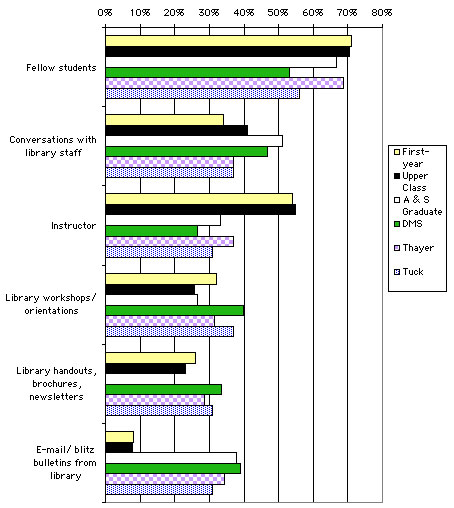
| 5. How Students Learn About Dartmouth Libraries, Services, and Resources |
| In each school, students reported "fellow students" as the primary source of information about the libraries, services, and resources. "Instructors" were the secondary source of information for the undergraduate students, while Arts and Sciences graduate and DMS students reported "conversations with library staff." |
|
Written Responses to "Other" uses
Self-taught (17 entries)
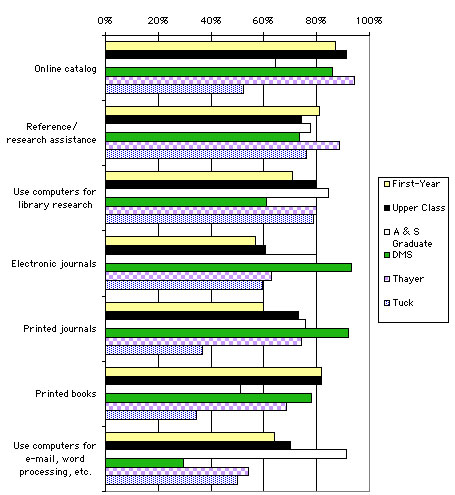
| 6. What Services Do Students Use Frequently? |
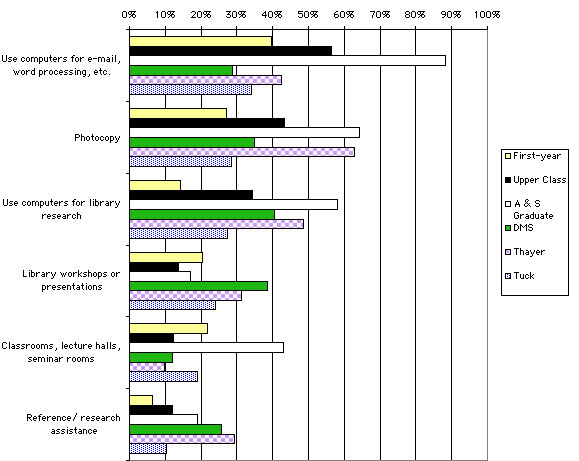
| "[Photocopying]," "[using] computers for e-mail, word processing, etc.," "[checking]-out materials," "[using] computers for library research," and "reference/research assistance" are the services used by the largest percentage of these students. The graph below shows the services that were used by the majority. Distinctive usage patterns were as follows: Distinctively high usage rates - DMS: "Interlibrary loan/document delivery" (82% vs. ~ 30% in the other groups), "use electronicforms for transactions�" (52% vs. ~ 20% in the other groups). Distinctively low usage rates - Tuck: "Reference/research assistance" (30% did not use vs. use by ~ 84% or more in the other groups), "check-out materials" (53% did not use vs. use by ~ 85% or more in the other groups). First-year: "Use computers for library research" (43% did not use vs. use by ~ 85% or more in the other groups). DMS and Tuck: "Use computers for e-mail, word processing, etc." (~ 31% did not use vs. use by ~ 90% or more in the other groups). First-year and DMS: "Photocopy" (~ 23% did not use vs. use by ~ 97% or more in the other groups). Thayer: "Classrooms, lecture halls, seminar rooms" (77% did not use vs. use by ~ 60% or more in the other groups). |
|
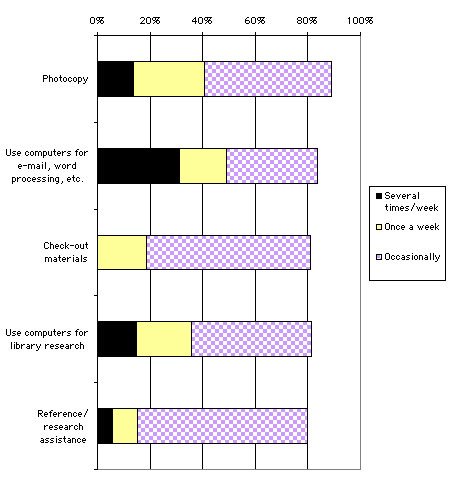
| The graph below reports usage at least "once a week." The services used most frequently are: "use computers for e-mail, word processing, etc.," "photocopying," and "use computers for library research." The undergraduate, Arts and Sciences graduate and Tuck students reported "[using] computers for e-mail, word processing, etc." as the most frequently used library service. Arts and Sciences graduate students "[used the] computers for e-mail, word processing, etc. far more than they used any other service and more than any other group. DMS students were moderate users of several services, while students from Thayer cited "photocopying" as their most frequently used service. |
 |
| "[Photocopying]," "[using] computers for e-mail, word processing, etc.," "[checking]-out materials," "[using] computers for library research," and "reference/research assistance" are the services used by the largest percentage of these students. The graph below shows the services that were used by the majority. Distinctive usage patterns were as follows: Distinctively high usage rates - Arts and Sciences Graduate: "Use computers for e-mail, word processing, etc." (84% vs. ~ 22% in the other groups). Low usage rates - First-year and Tuck: "Interlibrary loan/document delivery" (~ 88% did not use vs. use by 52% or more in other groups). First-year: "Use computers for library research" (43% did not use vs. use by 84% or more). Tuck: "Check-out materials" (53% did not use vs. use by 85% or more). First-year, Arts and Sciences Graduate, and Tuck: "Place holds and recalls" (~ 88% did not use vs. use by 43% or more). |
| 7. Student Satisfaction with Library Services |
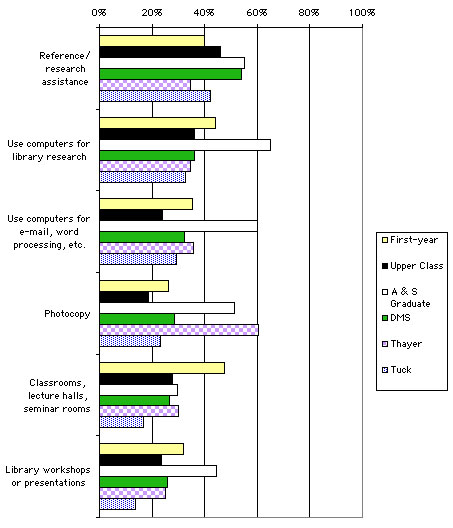
| At least 90% of all the students were at least satisfied with the services listed below (except for "photocopy" where the level was 88%). The graph below shows the percentages of students who were very satisfied with each service. Arts and Sciences graduate students were distinctively satisfied with the library's computers, while Thayer students and Arts and Sciences graduate students were distinctively satisfied with "[photocopying]." |
|
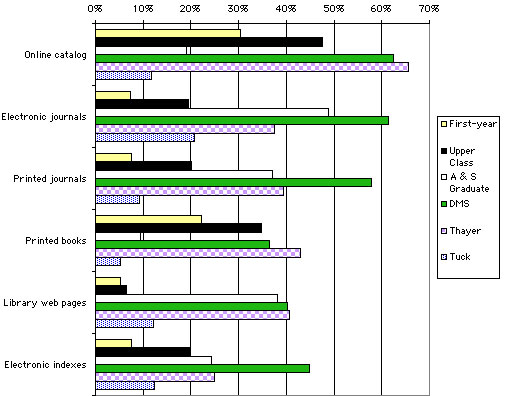
| 8. What Resources Do Students Use Frequently? |
| "Printed books," the "online catalog," and "printed journals" are the resources used by the largest percentages of these students. The graph below shows the resources that were used by the majority. Distinctive usage patterns were as follows: Distinctively high usage rates - DMS: "Library Web pages" (87% vs. ~ 54% in the other groups), "electronic journals" (94% vs. ~ 62% in the other groups); DMS students were also the heaviest users of "electronic indexes." DMS and Thayer: "Printed journals" (~ 97% vs. ~ 63% in the other groups). Distinctively low usage rates - Tuck: "Online catalog" (49% did not use vs. use by ~ 88% or more in the other groups), "printed books" (47% did not use vs. use by ~ 88% or more in the other groups). |
|
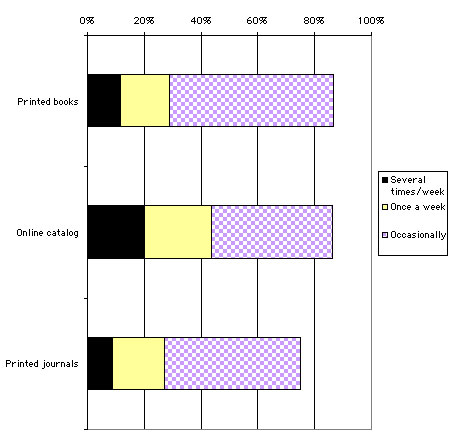
| The graph below shows the percentages of students who used each resource at least once a week. Undergraduate students used the "online catalog" more frequently than any other resource, followed by "printed books." Arts and Sciences graduate students used "electronic journals" more frequently than any other resource, while DMS students were relatively heavy users of the "online catalog," "electronic journals," and "printed journals". Thayer students used the "online catalog" more frequently than other library resource, while Tuck students did not distinctively use any resource. |
 |
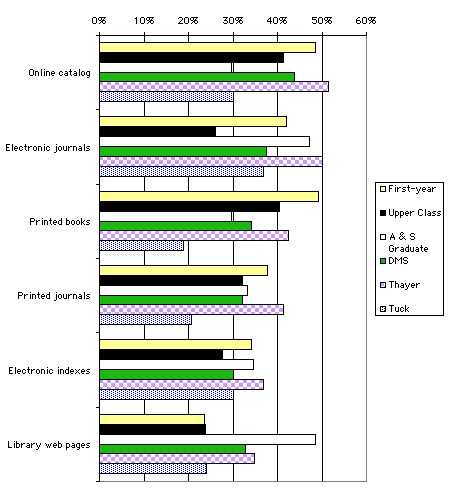
| 9. Student Satisfaction with Library Resources |
| At least 90% of these students were at least satisfied with the services below. The graph shows the highest level of satisfaction - very satisfied. The undergraduate students were most satisfied with "printed books" and the "online catalog." Arts and Sciences graduate students were most satisfied with "library web pages" and "electronic journals," while DMS students were most satisfied with the "online catalog" than any other resource. Thayer students were most satisfied with the "online catalog" and the "electronic journals," while Tuck students reported most satisfaction with "electronic journals." |
|
| 10. Most Important Services and Resources for Students' Dartmouth Experience |
| The first-year students placed most importance on the "online catalog," "printed books," and "reference/research assistance," while upper class students cited the "online catalog," "printed books," and "use computers for library research." The Arts and Sciences graduate students had distinctively high levels of "use of computers for e-mail, word processing, etc." and relatively high levels of "use computers for library research." DMS students assigned distinctively high levels of importance to "electronic and printed journals." Thayer students placed most importance on the "online catalog" and "reference/research assistance," while Tuck students considered "use of computers for library research" and "reference/research assistance" most important. |
|
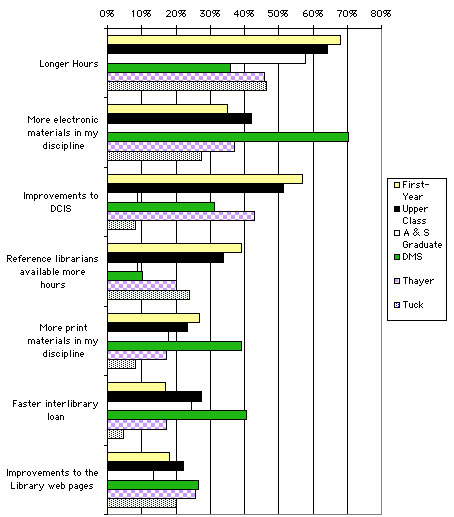
| 11. Changes to Services and Resources That Would Make Students' Dartmouth Experience More Effective |
| These undergraduate, Arts and Sciences graduate, and Tuck students reported that "longer hours" would make their Dartmouth experience more effective. Undergraduate students also had relatively high desire for "improvements to DCIS." "More electronic materials in my discipline" were most desired by DMS students, while Thayer students desired "longer hours" and "improvements to DCIS." |
|
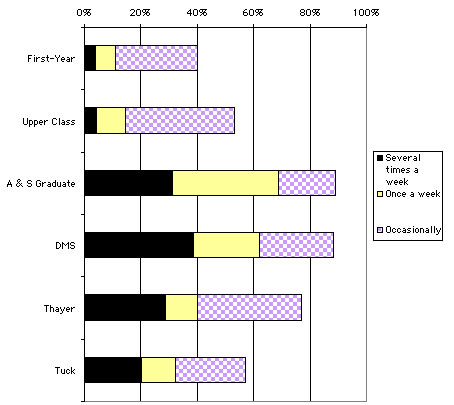
| 12. How Often Do Students Use the Library Web Site? |
| Undergraduate students use the library Web site considerably less than graduate students do. DMS students were most likely to use the Web site several times a week, followed by the Arts and Sciences graduate students. Both DMS and the Arts and Sciences graduate students were most likely to be at least occasional users. |
|
| 13. Why Students Infrequently or Never Use a Library Web Site |
| Thirty-eight percent of these students (250 from 660) reported that they infrequently or never (a single option in the questionnaire) used the Web site. Lack of knowledge about the library Web site was the reason cited most frequently for not using the Web site. |
Written Responses to "Other."
Don't need it (32 entries)
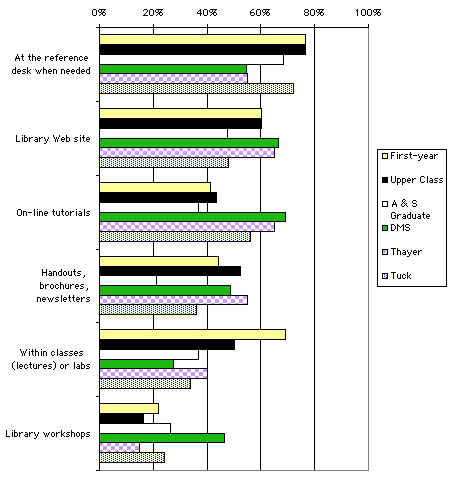
| 14. How Students Prefer to Have Instruction About Information Resources Delivered |
| Sixty-two percent of the students were interested in receiving instruction about information resources. The Arts and Sciences graduate students were the least interested (42%). First-year students preferred to receive instruction "at the reference desk when needed" and "within classes or labs." Upper class and Arts and Sciences graduate students preferred to receive instruction "at the reference desk when needed." DMS and Thayer students preferred to receive instruction about information resources through the "library Web site" and "online tutorials," while Tuck students preferred "the reference desk when needed." |
|
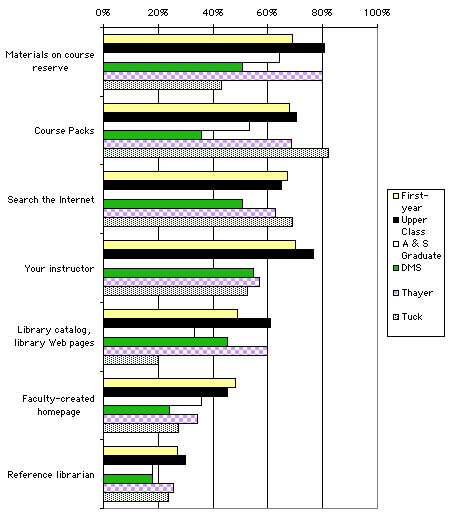
| 15. How Students Find Information for Class Assignments, Term Papers, etc. |
| First-year students said they find information through "[their] instructor," "materials on course reserve," "course packs," and by "searching the Internet," while upper class students said they find information through "materials on course reserve" and "[their] instructor." Arts and Sciences graduate and Thayer students find information through "materials on course reserve," while Tuck students use "course packs." |
|
Desired Services and General Comments
Verbatim comments and responses to a question on desired services and a general comments section are in the appendix. These comments and responses are available in paper copy from the Reserve Desk in Baker.