
Dartmouth College
Office of the Registrar
6014 McNutt Hall
Hanover, NH 03755-3541
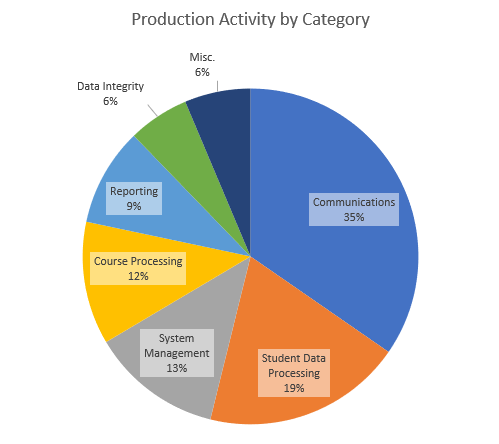
"Production" activities are those that are required in the usual academic cycle. Additional time is spent on "projects," and "service" which are described in the next section. Below are representations of our main functions and some general measurements of time spent on production.
We focus approximately ½ of our production activity on student and faculty communications and processing of student data, and ½ of our production time on internal records and system management.
While we are busy year-round:
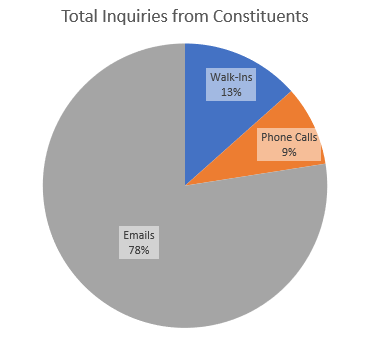
In the past year, we addressed approximately 22,500 inquiries directed to our primary email account (registrar@dartmouth.edu), up from about 20,000 in 2016-17. This total does not, however, include the many emails sent directly to staff members' personal accounts. Below is a chart that breaks down the emails received by category.
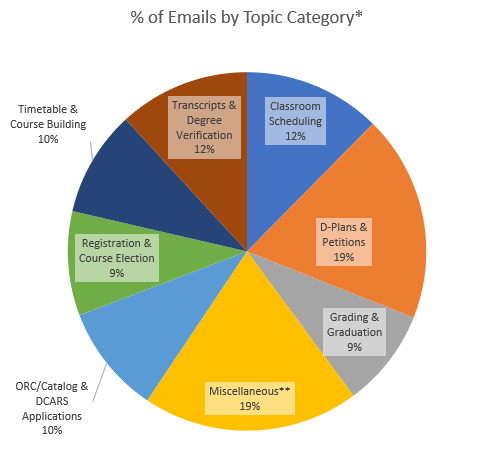
*The analysis of topic categories is based on an estimated percentage of total emails and a best-fit determination of topic as some inquires may fall in multiple categories.
**Miscellaneous includes the following categories: Access & Security, Degree Audit, Course Assessment, Curriculum & Policy, Final Exams, General Questions, Major/Minor Declaration, Reporting & Institutional Research, Transfer/Exchange/Pre-Matric, and VA Benefits.
In the past year, the Registrar's Office Staff:
| Academic Year | Official Transcript Total |
Paper Transcript Total | 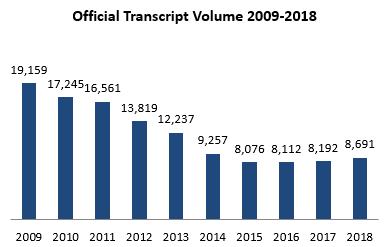 |
| 2009 | 19,159 | 19,159 | |
| 2010 | 17,245 | 17,245 | |
| 2011 | 16,561 | 16,561 | |
| 2012 | 13,819 | 13,819 | |
| 2013 | 12,237 | 9,839 | |
| 2014 | 9,257 | 4,625 | |
| 2015 | 8,076 | 3,601 | |
| 2016 | 8,112 | 3,264 | |
| 2017 | 8,192 | 2,701 | |
| 2018 | 8,691 | 1,829 |
| Year | Updates to Courses |
New Courses | Cross-lists Created | Courses Reinstated (no change) | Cross-lists Removed |
| 2014-15 | 400 | 184 | 186 | 0 | 0 |
| 2015-16 | 444 | 328 | 257 | 0 | 0 |
| 2016-17 | 186 | 257 | 59 | 14 | 0 |
| 2017-18 | 228 | 307 | 60 | 34 | 2 |
 |
|||||
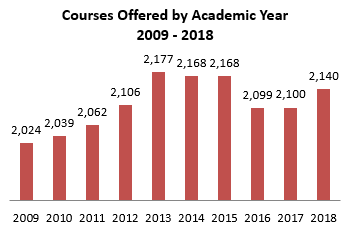
| Academic Year | 2009 | 2010 | 2011 | 2012 | 2013 | 2014 | 2015 | 2016 | 2017 | 2018 |
| Total | 2,024 | 2,039 | 2,062 | 2,106 | 2,177 | 2,168 | 2,168 | 2,099 | 2,100 | 2,140 |
 |
||||||||||
Each course count represents every offering with a unique subject, course number and title combination with the exception of cross-listed courses which are counted once. Off-Campus Study courses are included.
*Does not include classrooms assigned for small arranged courses, language drills, or other ad-hoc classroom assignments.
| Petition Type | Petition Count | |||||
|
|
2014 | 2015 | 2016 | 2017 | 2018 | 5-Year Average |
| Change in Grade | 121 | 151 | 136 | 134 | 131 | 135 |
| Add Course After Deadline | 81 | 108 | 116 | 113 | 129 | 109 |
| Drop Course After Deadline | 28 | 46 | 39 | 31 | 15 | 32 |
| Additional 2-Course Load | 47 | 48 | 71 | 46 | 40 | 50 |
| Additional 4-Course Load | 35 | 2 | 4 | 2 | 2 | 9 |
| Unlimited 2-Course Load | 2 | 4 | 4 | 8 | 2 | 4 |
| NRO After Deadline | 0 | 0 | 0 | 0 | 1 | 0 |
| NRO Grade Chg After Deadline | 0 | 0 | 0 | 0 | 0 | 0 |
| Repeat Course for Grade Only | 3 | 4 | 1 | 0 | 1 | 2 |
| Postpone Summer Term | 12 | 28 | 22 | 22 | 17 |
20 |
| Waive Summer Term | 64 | 59 | 62 | 41 | 59 | 57 |
| Exempt Summer Term | 23 | 19 | 20 | 22 | 27 | 22 |
| Additional Term in Residence | 77 | 87 | 73 | 63 | 59 | 72 |
| Five+ Year Enrollment Pattern | 84 | 85 | 104 | 80 | 71 | 85 |
| Reduce Sr Yr Residence Req | 288 | 328 | 349 | 330 | 215 | 302 |
| Late Exchange of Courses | 13 | 15 | 19 | 34 | 36 | 23 |
| Late D-Plan Change Fee Waiver | 16 | 8 | 6 | 2 | 0 | 6 |
| Reduced Tuition | 4 | 5 | 9 | 16 | 12 | 9 |
| Total | 921 | 998 | 1,035 | 944 | 817 | 943 |
Two petition types that increased notably last year - the Five+ Year Enrollment Pattern, and the Additional 2-Course Load (perhaps related) - have returned to prior levels; requests to postpone the summer term are much higher for the third year in a row. Reductions in the Senior Year Residency Requirement continue to represent both 1/3 of all petitions, and nearly 1/3 of the entire senior class. This number may start to shift downwards once the class of 2018, the first class impacted by the changed AP policy, graduates.
| 2009 | 2010 | 2011 | 2012 | 2013 | 2014 | 2015 | 2016 | 2017 | 2018 | |
| Manual Verifications | 1,385 | 1,549 | 1,332 | 754 | 430 | Over 273* | 514 | 112 | 589 | 508 |
| Self-Service Enrollment Verifications | 0 | 0 | 0 | 294 | 1,727 | 1,845 | 2,275 | 1,726 | 1,908 | 1,707 |
| Total | 1,385 | 1,549 | 1,332 | 1,048 | 2,157 | Over 2,118* | 2,789 | 1,838 | 2,497 | 2,215 |
Self-service enrollment verifications became available to students in April of 2012, which has led to a significant reduction in the office workload in this area, allowing staff to focus on higher level tasks.
*Some data missing for 2013-14.
We continue to investigate ways to reduce the number of manual verifications necessary.
Transfer Term Students
| Academic Year | 2009 | 2010 | 2011 | 2012 | 2013 | 2014 | 2015 | 2016 | 2017 | 2018 |
| Summer | 71 | 70 | 105 | 64 | 39 | 43 | 34 | 24 | 17 | 20 |
| Fall | 66 | 43 | 46 | 54 | 42 | 35 | 17 | 20 | 22 | 28 |
| Winter | 83 | 82 | 86 | 122 | 15 | 9 | 4 | 6 | 9 | 13 |
| Spring | 20 | 16 | 13 | 8 | 5 | 1 | 1 | 3 | 3 | 3 |
| TOTAL # of STUDENTS |
240 |
211 |
250 |
248 |
101 |
88 |
56 |
53 |
51 |
64 |
Note: The significant drop in the number of transfer term students which started in 2013 is a result of new Committee on Instruction (COI) policies.
Exchange Program Students
| Academic Year | 2009 | 2010 | 2011 | 2012 | 2013 | 2014 | 2015 | 2016 | 2017 | 2018 |
| Number of Students | 39 | 39 | 46 | 37 | 43 | 33 | 54 | 55 | 53 | 54 |
| Academic Year | 2011 | 2012 | 2013 | 2014 | 2015 | 2016 | 2017 | 2018 |
| Undergraduate Students | 26 | 28 | 32 | 32 | 35 | 36 | 42 | 51 |
| Graduate Students | 9 | 12 | 8 | 6 | 5 | 8 | 9 | 8 |
| Chapter 31 | 4 | 2 | 2 | 2 | 2 | 2 | 5 | 3 |
| Chapter 30 | 6 | 3 | 1 | 1 | 0 | 1 | 1 | 0 |
| Chapter 35 | 4 | 5 | 7 | 3 | 6 | 7 | 6 | 5 |
| Chapter 1606 | 0 | 0 | 0 | 0 | 0 | 0 | 1 | 1 |
| Chapter 33: Post 9/11 GI Bill recipients | 21 | 30 | 30 | 32 | 32 | 34 | 38 | 49 |
| Students eligible for the Yellow Ribbon program | 11 | 25 | 24 | 28 | 29 | 30 | 34 | 46 |
| TOTAL number of students certified |
35 | 40 | 40 | 38 | 40 | 44 | 51 | 59 |
Our Office certifies A&S Graduate as well as Undergraduate VA benefit recipients.
| Graduates | |||||||||||
| Academic Year | 2009 | 2010 | 2011 | 2012 | 2013 | 2014 | 2015 | 2016 | 2017 | 2018 | |
| Summer | 13 | 17 | 22 | 27 | 35 | 22 | 30 | 20 | 26 | 25 | |
| Fall | 27 | 40 | 32 | 31 | 24 | 33 | 30 | 39 | 24 | 31 | |
| Winter | 28 | 25 | 38 | 30 | 31 | 29 | 40 | 33 | 32 | 28 | |
| Spring | 998 | 1,003 | 984 | 1,005 | 969 | 1,032 | 993 | 985 | 987 | 1,062 | |
| Total | 1,066 | 1,085 | 1,076 | 1,093 | 1,059 | 1,116 | 1,093 | 1,078 | 1,069 | 1,146 | |